
Sixteen Years of Fort Walton Beach Budgets: The Rate Fell, the Bill Didn't
The city's property-tax rate is lower today than it was in 2010. Its budget is nearly twice the size. Sixteen adopted budgets, lined up, show how both of those things are true at once — and who actually pays.
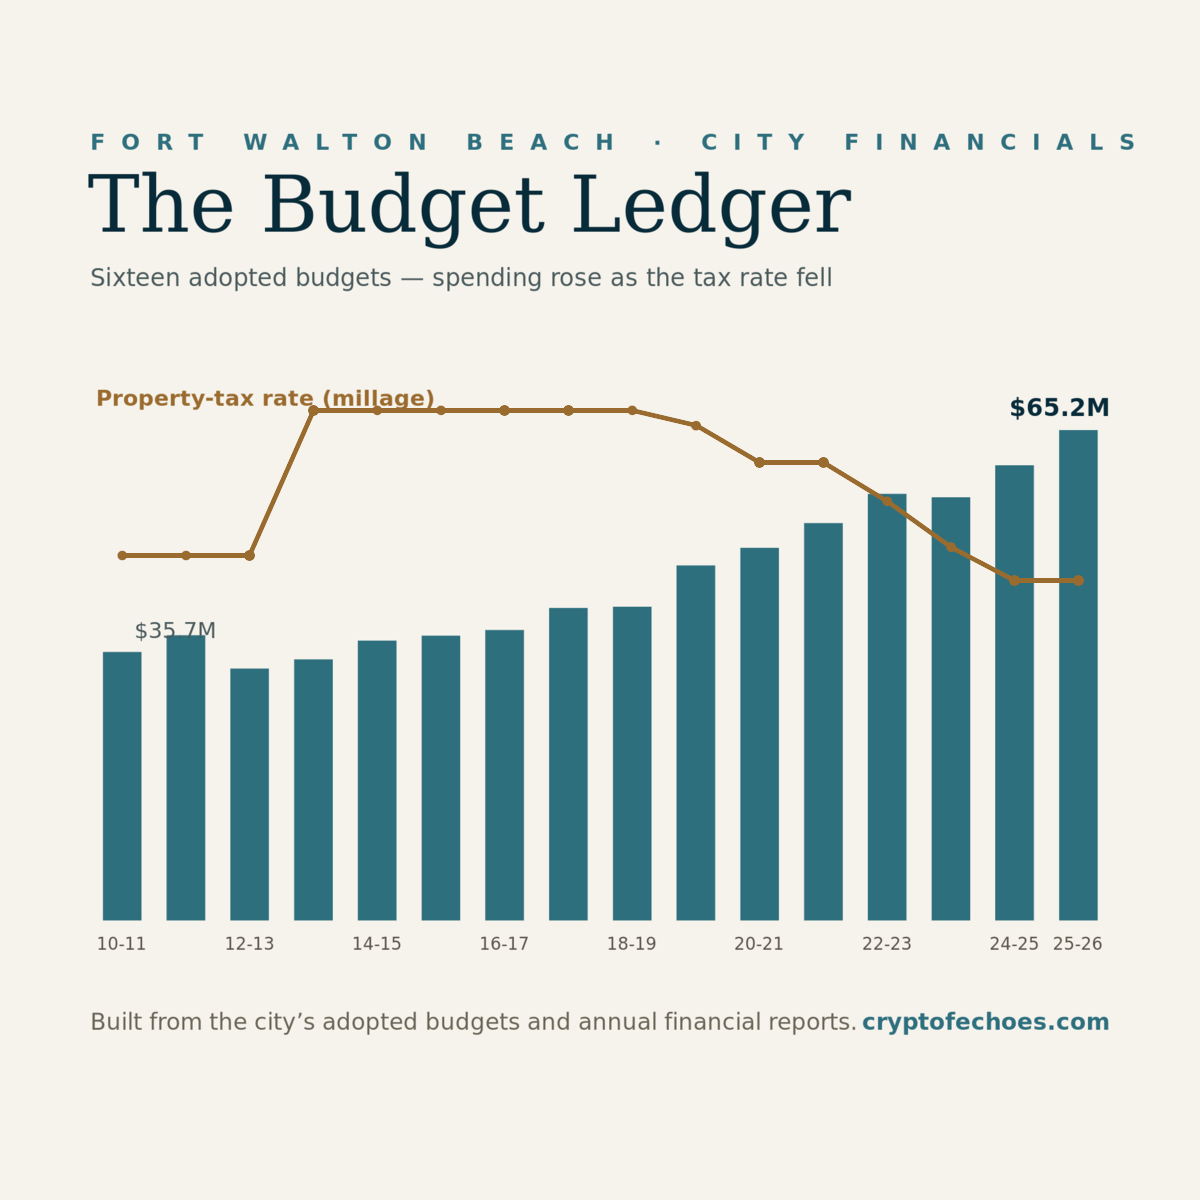
A city budget is a moral document disguised as a spreadsheet: it says, in dollars, what a place has decided to pay for. Fort Walton Beach adopts one every year, hundreds of pages long, and almost no one reads two of them back to back. We read sixteen. Laid end to end, from fiscal 2010-11 through 2025-26, they tell a story that neither a tax-cut press release nor a rising-bill complaint captures on its own — because both are true. The rate came down. The money went up. The reason is the thing in between: the value of the city itself.
The top line: up 83 percent
In fiscal 2010-11, Fort Walton Beach adopted a total budget — all funds combined — of about $35.7 million. In fiscal 2025-26, the figure is about $65.2 million. That is growth of roughly 83 percent over sixteen years, well ahead of general inflation over the same stretch. [1]
The general fund, which pays for the services most residents picture when they think of city government — police, administration, parks, the bulk of day-to-day operations — grew from about $17.6 million to about $32.2 million across the same period. The city's full-time-equivalent staffing rose more modestly, from roughly 298 positions to about 320. [2]
A budget is an authorization to spend, not a record of money already spent; the audited figures live in the annual financial reports, which the city publishes separately. But the adopted budgets are where the city states its intentions, in advance and on the record, and sixteen of them in a row show those intentions bending in a consistent direction.
The city cut its tax rate five times. It also collects far more property tax than it did in 2010. The ground underneath both facts is the same: assessed value roughly doubled.
The millage story most people get half-right
The property-tax rate — the millage, the dollars of tax per $1,000 of taxable value — is where the sixteen-year record contradicts the easy version of events. For the first three years shown, the rate held at 4.5383 mills. Then, in fiscal 2013-14, the city raised it to 5.7697 mills: a single, substantial increase. [3]
What happened next is the part that rarely makes it into a bumper sticker. From that 2013-14 peak, the city cut the rate five times — to 5.6395, then 5.3293, 4.9999, 4.6116, and finally 4.3282 mills, where it has held for the two most recent years. The rate today is actually lower than the 4.5383 the city charged back in 2010-11. On the question 'did Fort Walton Beach raise or cut taxes,' the honest answer is: it did both, in that order, and ended up below where it started. [3]
Anyone who tells you only the 2013 increase, or only the five later cuts, is telling you a true half of the story. The record holds both halves at once.
Why a lower rate still means a bigger bill
Here is the number that reconciles the contradiction: taxable value. The total taxable value of property in Fort Walton Beach rose from about $1.21 billion in 2010-11 to about $2.42 billion in 2025-26 — it roughly doubled. [4]
A tax bill is the rate multiplied by the value. If the value of your property climbs faster than the rate falls, your bill goes up even as the rate goes down — and the city's total property-tax revenue climbs with it. That is the mechanism behind the whole sixteen-year arc. The council could lower the millage five times and still preside over rising collections, because the base it was applying the millage to was expanding underneath it.
This is not unique to Fort Walton Beach; it is how ad-valorem taxation works everywhere property values are rising. But the local specifics — how fast values climbed, how far the rate fell, whether the two moved together or apart — are exactly what a sixteen-year view makes legible, and exactly what a single year's budget cannot.
Where the money actually goes
A city budget is not one pot of money. It is a set of funds, each with its own rules about what the money can be spent on. The general fund is the largest and most flexible. Alongside it, the budgets track a water and sewer fund, a sanitation fund, a stormwater fund, a Community Redevelopment Agency, a municipal golf operation, debt service, a sales-tax and tourism category, and a handful of smaller funds.
The Budget Ledger breaks each year into those groups, so you can watch an individual fund rise or fall rather than only the grand total. A water-and-sewer fund that jumps in a given year, or a golf operation that runs at a particular scale, is visible as its own line — which matters, because 'the budget went up' can mean very different things depending on which fund did the going-up. [5]
The budgets also report operating indicators that put the dollars in context: staffing levels, and the taxable-value and rate figures that drive the revenue side. The view pulls those together so the spending and the money that funds it sit on the same page.
The funds that tell their own stories
Spend time with the individual funds and the character of the city's finances comes into focus in a way the grand total hides. The water and sewer fund is the second-largest after the general fund, and the most volatile — a utility that must periodically fund major capital work, so its budget jumps in the years the city invests in pipes and plants and settles back in the years it does not. The sanitation fund carries the recurring cost of waste collection and the landfill obligations behind it.
The smaller funds are where the interesting governance questions live. The stormwater fund pays for the drainage a flat coastal city cannot do without; how its costs are classified, and whether drainage work is counted as stormwater or folded elsewhere, is exactly the kind of line-item decision that shapes what residents are told the system costs. The Community Redevelopment Agency, the municipal golf operation, and the debt-service fund each run on their own logic, and each has been the subject of real local debate about whether a city this size should be in that business at all.
Then there are the quiet entries — pension obligations, delinquent property-tax accounting, and the handful of small funds that carry the city's odds and ends. These rarely make headlines, but they are where long-term liabilities hide, and a sixteen-year view is the only way to see whether a given obligation is growing faster than the budget that has to absorb it. The Budget Ledger breaks the total into these groups precisely so that 'the budget went up' can be interrogated rather than simply repeated. [5]
What drove the doubling
The engine of the entire sixteen-year story is that taxable value roughly doubled, from about $1.21 billion to about $2.42 billion. It is worth asking what produced that, because the answer shapes how durable the city's finances actually are.
Part of it is new construction and redevelopment — a genuinely larger city, with more and more valuable property on the roll. Part of it is reassessment: the broad rise in Florida coastal real-estate values over the 2010s and into the 2020s lifted the assessed value of property that already existed, without the city adding anything. The two are not the same. Growth from new construction tends to bring new costs — more streets, more service area, more demand — while growth from reassessment is closer to a windfall, revenue that arrives without a corresponding obligation.
This distinction matters for the next decade. A tax base inflated by a hot property market can deflate when the market cools, and Florida's markets do cool. A council that has cut its millage five times on the strength of rising values has less room to cut, and more pressure to raise, if those values stall. None of that is predicted by the record — but the record is what lets a resident ask the question with real numbers instead of a hunch.
Who pays the most
Every annual financial report includes a list of the city's principal property taxpayers — the ten owners with the highest taxable assessed value — and the Budget Ledger charts the 2016 and 2025 lists together. These are property taxpayers, ranked by assessed value, not sales-tax remitters; the distinction matters, and the view labels it plainly.
At the top of both lists is the electric utility: Gulf Power, now Florida Power & Light, whose infrastructure carries the single largest assessed value in the city. Its taxable value grew from about $20.4 million in 2016 to about $50.5 million in 2025. Below it sit large commercial and hospitality holdings — a major mixed-use property, hotels, a cable and communications company. Together the top ten held about 6.42 percent of the city's taxable value in 2016 and about 8.08 percent in 2025, a modest concentration that nonetheless shows a handful of owners carrying a meaningful slice of the ad-valorem base. [6]
The list is a useful corrective to the intuition that homeowners carry the city. A utility's substations and lines, a hotel's land and building — these are the properties at the top of the roll, and their assessed values are public record.
The staffing line, read carefully
Full-time-equivalent staffing is one of the quietest and most revealing numbers in a budget. Fort Walton Beach's hovered just under 300 for the first half of the record, then rose past 310 and up to about 320 in the most recent years. Measured against a budget that grew 83 percent, headcount grew far more slowly — which tells you that most of the budget's growth is not simply more people, but higher costs per person, larger capital and fund transfers, and the rising price of the services the city already provided.
That is the kind of inference a reader can only draw by holding spending and staffing side by side across many years. One budget shows you a staffing number. Sixteen show you whether the city is growing its workforce or growing the cost of its existing one.
How to read the view
The interactive version — the Budget Ledger — puts all sixteen years on one page: the rising stack of spending by fund, the falling line of the millage rate, the doubling of taxable value, a tax-bill estimator you can slide to your own property's value, and a 'city by the numbers' panel of operating indicators. Choose a year and you can open the city's adopted budget or its annual financial report for that year and read the underlying document. [7]
Every figure traces back to a preserved source — the adopted budgets and the annual financial reports, specifically the budget summary tables and the statistical schedules where the taxable values and principal-taxpayer lists live. The view organizes the numbers; it does not replace them, and it does not claim they are audited truth. It claims only that this is what the city adopted and reported.
Explore it at cryptofechoes.com/collections/fwb-budgets.
What sixteen budgets can and can't settle
The record settles some arguments cleanly. Did the city cut its tax rate? Yes, five times, and the rate is now below its 2010 level. Did residents' property-tax bills and the city's collections nonetheless rise? Also yes, because assessed values roughly doubled. Both of those are facts the documents establish, and anyone claiming only one of them is leaning on half the evidence.
What the budgets cannot settle is whether the spending was wise, whether the services kept pace with the money, or whether the next value downturn — and Florida has them — will force the rate back up. Those are judgments, and they belong to residents, the council, and the reporters who will bring specific questions to specific line items. A sixteen-year ledger is not a verdict. It is a well-lit room in which to argue, with the original documents stacked on the table and one click away.
That is finally the case for reading a budget as a sixteen-year record rather than a yearly announcement. A single budget is a press release waiting to happen — a number the city can frame however it likes, confident that almost no one will check it against last year's. A run of sixteen is harder to spin, because the trend is visible and the contradictions surface on their own. The tax rate fell; the bills rose; the base doubled; the spending grew faster than the staff. None of those facts is hidden, and none of them can be told in isolation without misleading. The ledger's only argument is that residents deserve to see all four at once — and then decide for themselves what the city they pay for is becoming.
Sources & archive records
- Fort Walton Beach adopted budget — FY 2010-11
Baseline year; total about $35.7M, millage 4.5383, taxable value about $1.21B.
- Fort Walton Beach adopted budget — FY 2013-14 (millage increase)
The single rate increase in the record, to 5.7697 mills.
- Fort Walton Beach adopted budget — FY 2012-13
Last year at the 4.5383 rate before the increase.
- Fort Walton Beach City Budget & Financial Reports — the Budget Ledger (data view)
Interactive view of sixteen budgets and the annual financial reports, each linking its original document.
Keep reading
View all
Fort Walton Beach Sets Two Tuesday Meetings; Council Email Comments Due by 2 P.M.
The CRA meets at 4 p.m. and City Council at 6 p.m. on October 27.
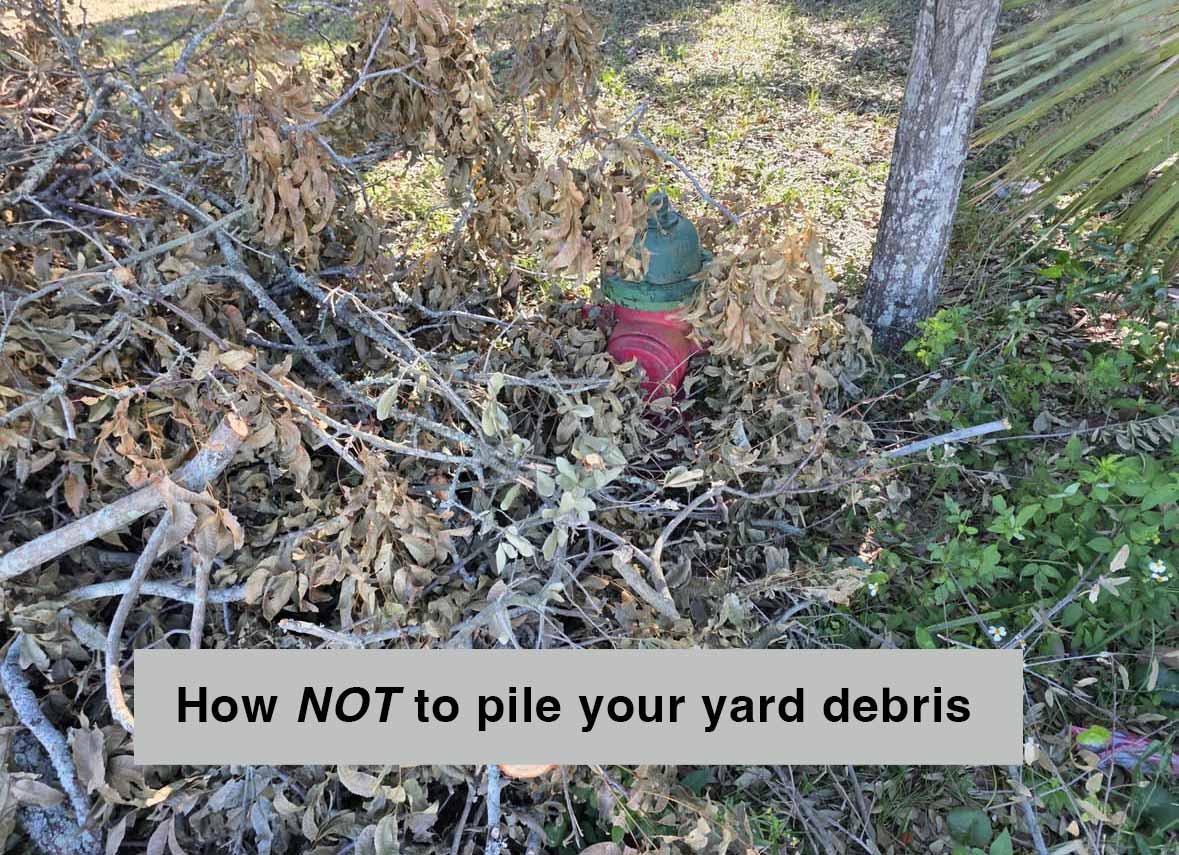
Fort Walton Beach Separates Household Bulk Pickup From Storm Debris
The city’s recovery plan has no fixed collection days.
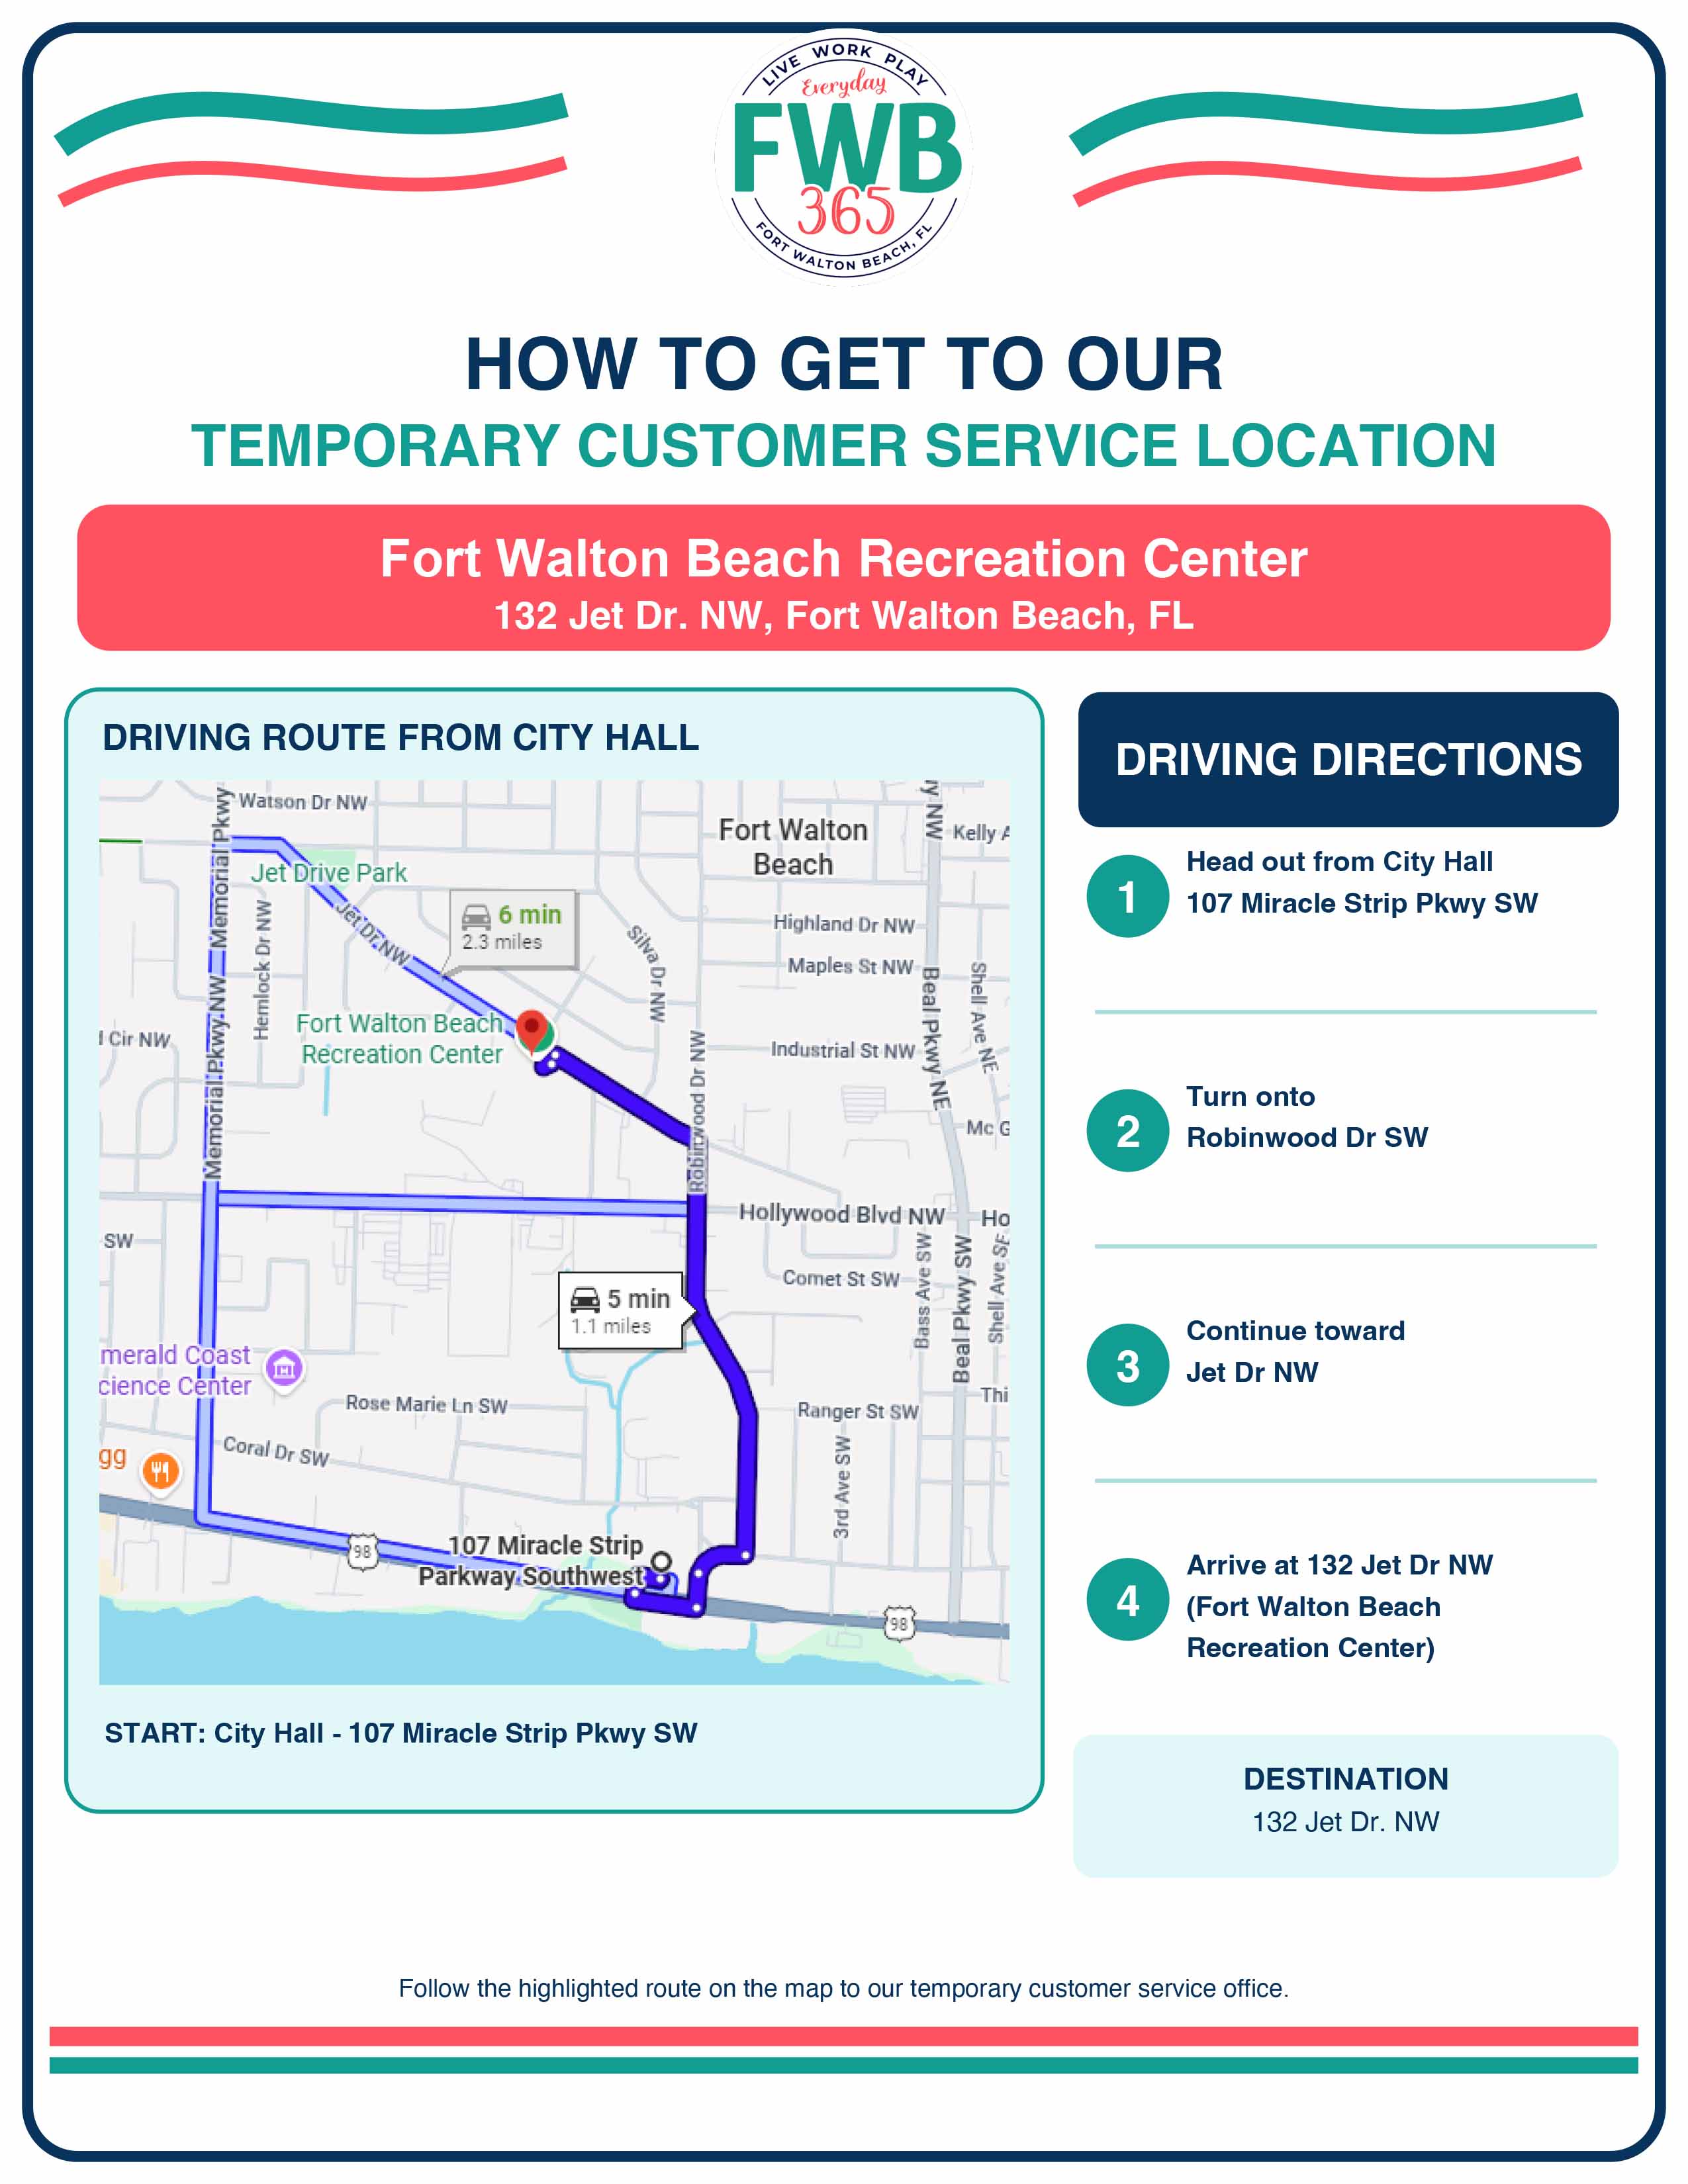
Fort Walton Beach Utility Payments Move to Recreation Center During Recovery
The city lists alternative payment methods and says it is suspending late fees and water-service terminations during hurricane recovery.