
Fourteen Years of Fort Walton Beach Tap Water, in One Place
The city publishes a drinking-water report every year. We put 2012 through 2025 side by side. The water has stayed within federal limits — but the chlorination byproducts are the number to watch, and the record also preserves the years the testing slipped.
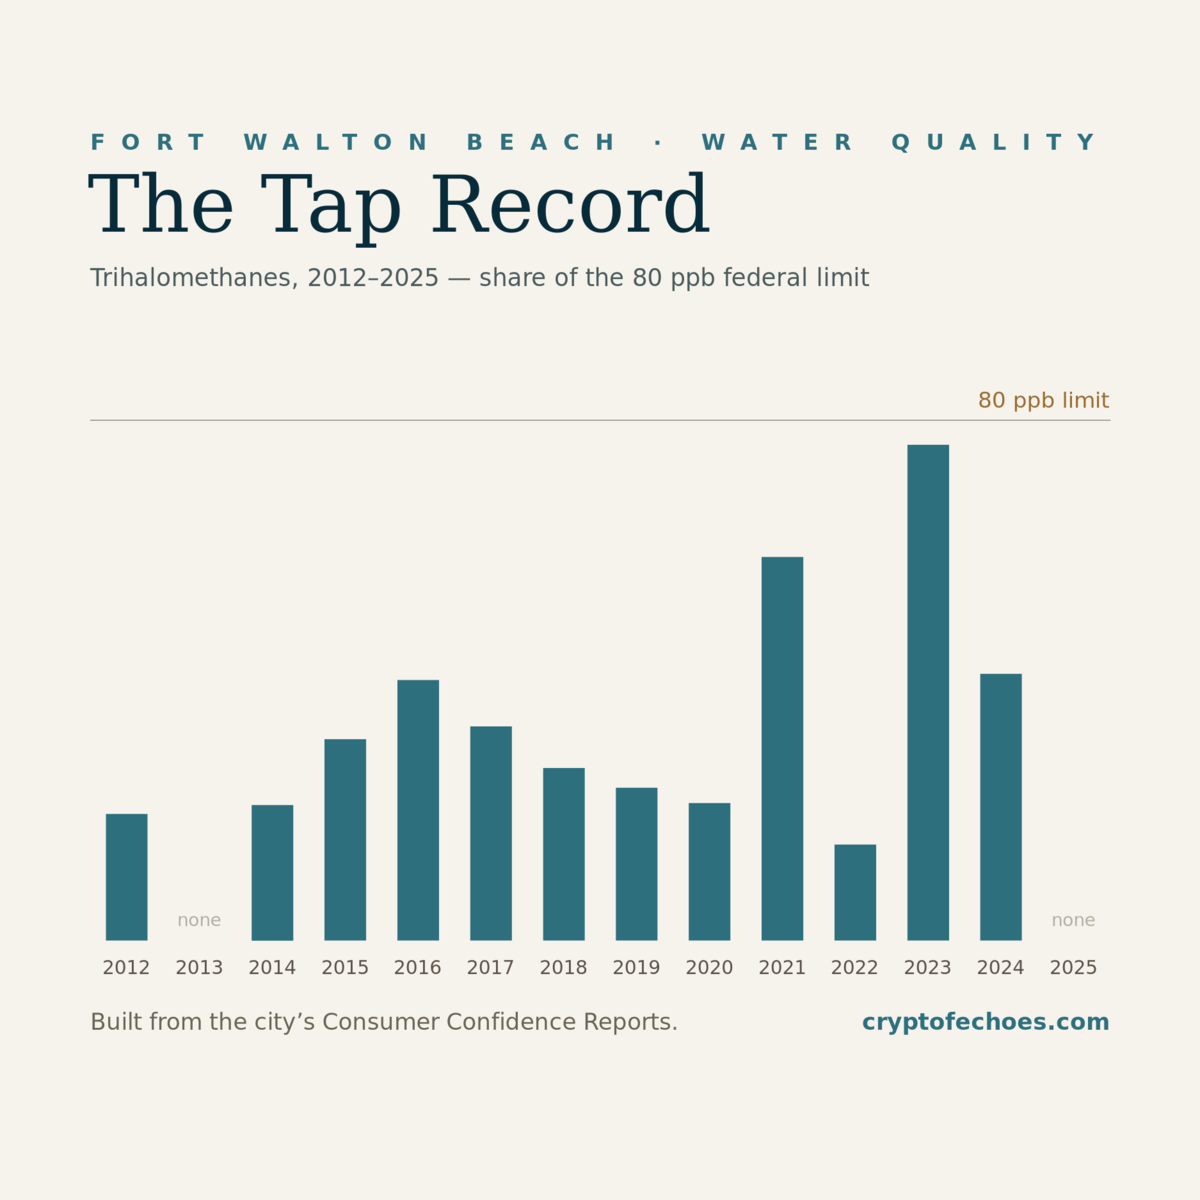
Every spring, the City of Fort Walton Beach mails out a document almost nobody reads: the Consumer Confidence Report, a federally required accounting of what its testing found in the drinking water the year before. Each one is a snapshot. Lined up, fourteen of them tell a story — about a utility that has kept its water inside the federal limits, about the one family of contaminants that keeps climbing toward the line, and about the two years the testing itself went wrong. We gathered every report from 2012 through 2025 and put them in a single view, so the trend is something you can see instead of something you have to take on faith.
What the reports are, and are not
Fort Walton Beach draws its drinking water from wells in the Floridan Aquifer, treats it with aeration and chlorination, and serves it under public water system ID 1460144. Federal rules require the city to test for dozens of contaminants and to summarize the results once a year in a Consumer Confidence Report, often called a CCR or water-quality report. [1]
A report is a legal record of what was measured, not a guarantee of what is in any given glass on any given day. The samples are taken on a schedule; some contaminants are tested every year, some once every three years, and a few are reported as the most recent valid result even when that result is several years old. Reading one report tells you about one year. Reading fourteen in a row tells you where the numbers are heading — which is why we built the view. [2]
Every figure below comes from the city's own reports, preserved page-for-page in a public archive. Where a value looked unusual, we checked it against the report's own footnotes rather than smoothing it over. The point is not to alarm or reassure; it is to let the record speak at full length.
The water has stayed legal. The question the record raises is how much margin is left.
The number that matters: trihalomethanes
If you read only one line of a Fort Walton Beach water report, read the one for total trihalomethanes — TTHM. Trihalomethanes are not added to the water; they form when the chlorine used to disinfect it reacts with natural organic matter already present. They are a normal consequence of chlorination, and the Environmental Protection Agency caps them at 80 parts per billion as a running annual average, because long-term exposure at higher levels is associated with health risks.
For most of the past fourteen years, Fort Walton Beach's TTHM numbers sat comfortably in the 20s and 30s: 19.8 ppb in 2012, 21.2 in 2014, 31.5 in 2015, 33.5 in 2017. Then they began to swing. The reported level reached 60.1 ppb in 2021, dropped to 15 in 2022, and climbed to 77.7 ppb in 2023 — about 97 percent of the federal limit, the closest any measured contaminant in these reports has come to its ceiling. [3]
That 2023 figure is the single most important data point in the fourteen-year record, and it deserves to be read carefully. It is a level-detected value, not a violation on its own; the enforceable standard is a running average across sampling locations and quarters. But a single reading that high is the kind of thing a utility watches, because the annual average is built from readings like it.
The 2025 number that wasn't
The 2025 report is where the archive earns its keep. The headline trihalomethane figure in that report is above the 80 ppb limit — a number that, taken at face value, would describe a violation. But the report's own footnote attributes the result to a laboratory error, and it says routine testing resumes in July 2026. [4]
We show that year in the view as the city reported it — high, over the line — with the lab-error explanation attached, rather than quietly dropping it or silently 'correcting' it. A preserved record that hides its own ugly data points is not preserved; it is edited. The honest version is the one that shows the number and the footnote together and lets the reader weigh them.
The same 2025 report also notes that one of the city's wells tested positive for E. coli in January, was taken out of service and purged, returned two clean follow-up samples, and went back into service. That is the system working as designed: a positive result, a response, a confirmation. It is in the record because the city put it there.
The two years the testing slipped
Twice in fourteen years, the problem was not the water but the paperwork. In 2013, the required sampling for disinfection byproducts — the trihalomethanes and haloacetic acids — was missed entirely. The city reported it as a monitoring and reporting violation and said the lapse had no established effect on water quality, because no samples existed to show otherwise. In our view, 2013 is the year with no glass to fill. [5]
In April 2015, three routine samples came back positive for total coliform bacteria — two more than the rule allows in a month — which is a maximum-contaminant-level violation for total coliform. Follow-up sampling was done. Total coliform is used as an indicator: its presence signals that conditions could allow harmful organisms, not that harmful organisms were necessarily present. [6]
Neither event is hidden in the archive, and neither should be. A utility that reports its own misses is more trustworthy than one whose record is suspiciously clean. But a reader is entitled to know they happened, and to count them.
Chlorine, creeping up
The disinfectant itself is worth watching for a quieter reason. The annual-average chlorine residual — the amount of chlorine left in the water as it travels the pipes — has risen steadily, from 0.72 parts per million in 2012 to 1.19 ppm in 2025. That is still far below the 4.0 ppm maximum residual disinfectant level the EPA allows, so it is not a compliance concern.
But chlorine is also the raw material for trihalomethanes. More disinfectant in the system, all else equal, means more opportunity for the byproduct reaction that produces TTHM. The chlorine line and the trihalomethane line are not independent; reading them together is part of why a multi-year view is more useful than any single report.
Haloacetic acids, the second byproduct family
Trihalomethanes have a less-famous sibling. Haloacetic acids — reported as the sum of five of them, or HAA5 — are the other major family of disinfection byproducts, formed by the same reaction between chlorine and organic matter, and capped by the EPA at 60 parts per billion. They tend to move with trihalomethanes, but not perfectly, and the Fort Walton Beach record shows the two diverging in instructive ways.
For most of the fourteen years, HAA5 ran in the single digits: 4.9 ppb in 2012, 4.6 in 2014, 5.7 in 2015. Then it climbed. The reported figure reached 21.9 ppb in 2019 — a year when trihalomethanes actually fell — and peaked at 24.2 ppb in 2021, about 40 percent of its limit, the highest HAA5 reading in the record. [3]
Unlike the trihalomethane line, the haloacetic-acid line has never crossed half of its ceiling. That is genuinely reassuring on its own terms. But the 2019 divergence — HAA5 up while TTHM was down — is a reminder that the two byproducts respond to slightly different conditions in the system, and that watching only the headline trihalomethane number can miss a move in its quieter sibling. A view that shows both at once is the only way to catch that.
Lead, copper and the household tap
Lead and copper are measured differently from the other contaminants: not at the treatment plant but at a sample of household taps, and reported as a 90th-percentile value across 30 homes, tested once every three years. The action level for lead is 15 ppb. Across all fourteen years, Fort Walton Beach's 90th-percentile lead result never approached it — ranging from 5.2 ppb down to 1.7 ppb in the most recent rounds. [7]
The reports are careful about a distinction that is easy to miss. In the 2017, 2018 and 2019 rounds, one of the 30 sampled homes came in over the 15 ppb action level — but the 90th-percentile figure, the number the rule actually regulates, stayed well under it at 2.3 ppb. One high house out of thirty is not a system-wide exceedance, and the report says so. Copper, sampled the same way, stayed under a fifth of its own action level throughout.
Sodium, fluoride and the things the aquifer adds
Not everything in the water comes from treatment. Sodium, which the reports attribute to saltwater intrusion and the natural leaching of minerals, has sat between 110 and 120 ppm in every round — under Florida's 160 ppm guidance level, but high enough that the reports flag it for residents on sodium-restricted diets. Fluoride, which occurs naturally in the aquifer, has run near 1.2 ppm; the 2025 report states the city does not add more. [8]
These are the fingerprints of the source. A coastal Florida utility pulling from the Floridan Aquifer will show sodium and fluoride signatures that an inland system would not, and the fourteen-year record makes those steady background levels easy to separate from the contaminants that move with treatment.
What a resident can do with this
A fourteen-year record is more useful to a resident than a single mailer, and not only as reassurance. If you are on a sodium-restricted diet, the steady 110-to-120 ppm sodium level is a number worth showing your doctor, and it has not meaningfully changed in fourteen years. If you are concerned about lead in an older home, the city's 90th-percentile figure tells you about the system, not about your particular pipes — the only way to know your own tap is to have it tested, and the reports explain how to request that.
If the chlorination byproducts are what concern you, the record gives you the specific, honest answer that a single year cannot: the levels have stayed within the federal limit, trihalomethanes touched 97 percent of theirs in 2023, and the 2024 report shifted to a quarterly running average that smooths the year-to-year swings. None of that requires a chemistry degree to read once the fourteen years are lined up. It requires only that the reports be gathered in one place and shown honestly — which is the entire point of the exercise.
And if a number worries you, the right destination is not a comment section but the city's utilities department and the next council meeting, with the specific report and the specific figure in hand. The record is built to be carried into that room.
How to read the view
The interactive version of this record — we call it the Tap Record — lays out all seven measures as a shelf of glasses, one glass per year, each filled to that year's result as a share of its legal limit, with a dashed line marking the limit itself. Choose a measure and you can watch fourteen years of it at a glance; choose a year and you can open the city's original report for that year and read it yourself. [9]
Where a report repeats a result from an earlier sampling round rather than taking a fresh sample, the glass is hatched and the underlying table says when the sample was actually taken, so a three-year-old lead number is never mistaken for this year's. The 2013 gap and the 2025 lab-error reading are both shown as the reports describe them. The view organizes the figures; it does not replace the evidence, and every year links back to the preserved document.
Explore it at cryptofechoes.com/collections/fwb-water-quality.
What the record shows, and what it doesn't
Read end to end, the fourteen-year record supports a modest, specific conclusion: Fort Walton Beach's drinking water has stayed within federal limits, with two reporting-side lapses and one disputed 2025 reading, and the one family of contaminants worth watching is the chlorination byproducts, which touched 97 percent of their limit in 2023 before the 2024 reporting shifted to a quarterly running average.
What the record cannot tell you is why the trihalomethane numbers swing the way they do from year to year, or what the 2025 samples would have shown without the lab error, or what the running average will look like once the 2026 testing resumes. Those are questions for the city and its lab, and they are the right questions to bring to a public-records request or a council meeting. A preserved report establishes what was recorded. It does not automatically establish whether every claim in it is true — and the honest way to use it is as a starting point, with the original always one click away.
Sources & archive records
- Fort Walton Beach Consumer Water Quality Report — 2012
Baseline year; TTHM 19.8 ppb, chlorine 0.72 ppm.
- Fort Walton Beach Consumer Water Quality Report — 2013 (missed DBP sampling)
Reports the missed trihalomethane/haloacetic-acid sampling as a monitoring and reporting violation.
- Fort Walton Beach Consumer Water Quality Report — 2015 (coliform violation)
Total coliform MCL violation in April; three positive samples; follow-up sampling done.
- Fort Walton Beach Consumer Water Quality Report — 2023 (TTHM 77.7 ppb)
Highest measured trihalomethane level in the 14-year record, ~97% of the 80 ppb limit.
- Fort Walton Beach Consumer Water Quality Report — 2025 (lab error; E. coli well event)
TTHM result above the 80 ppb limit attributed to a lab error; testing resumes July 2026; January E. coli well positive, purged and returned to service.
- Fort Walton Beach Water Quality Reports — the Tap Record (data view)
Interactive view of all seven measures, 2012–2025, each linking its original report.
Keep reading
View all
Okaloosa County: Two Water Advisories, Two Different Problems
The October 2 and October 11 notices preserved in the archive identify different places, evidence, and triggers.
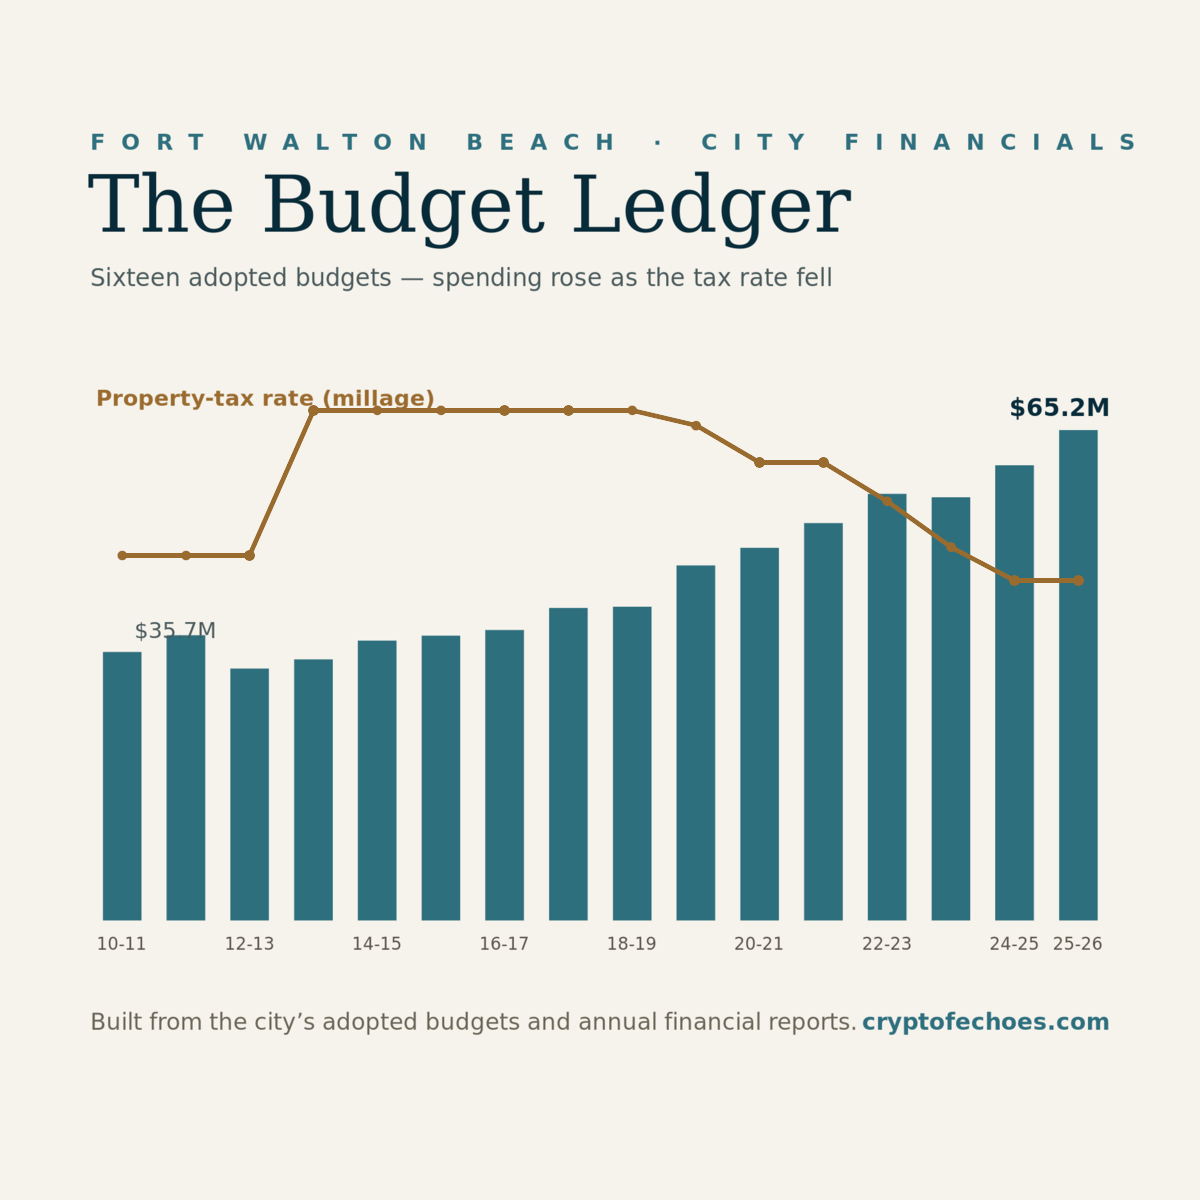
Sixteen Years of Fort Walton Beach Budgets: The Rate Fell, the Bill Didn't
The city's property-tax rate is lower today than it was in 2010. Its budget is nearly twice the size. Sixteen adopted budgets, lined up, show how both of those things are true at once — and who actually pays.

Fort Walton Beach Sets Two Tuesday Meetings; Council Email Comments Due by 2 P.M.
The CRA meets at 4 p.m. and City Council at 6 p.m. on October 27.